Accuracy Precision Recall Rocauc
Accuracy
- Accuracy is very simple. It is number of correct predictions divided by the length of output (number of classes in a classifier)
n_correct / len(y_pred)
Accuracy is a not a very good performance measure especially when there are skewed values in the dataset. The accuracy of a “Dog or Not” Classifier will be high if the number of input images of dogs are significantly higher than other images.
That does not mean the Model is accurate. We need other performance measures to figure that out.
Precision
Precision is accuracy of positive predictions. The formula would be
Precision=TP/(TP+FP)
TP – True Positives
FP – False Positives
Precision is generally used along with another metric called recall or sensitivity or the true positive rate (TPR)
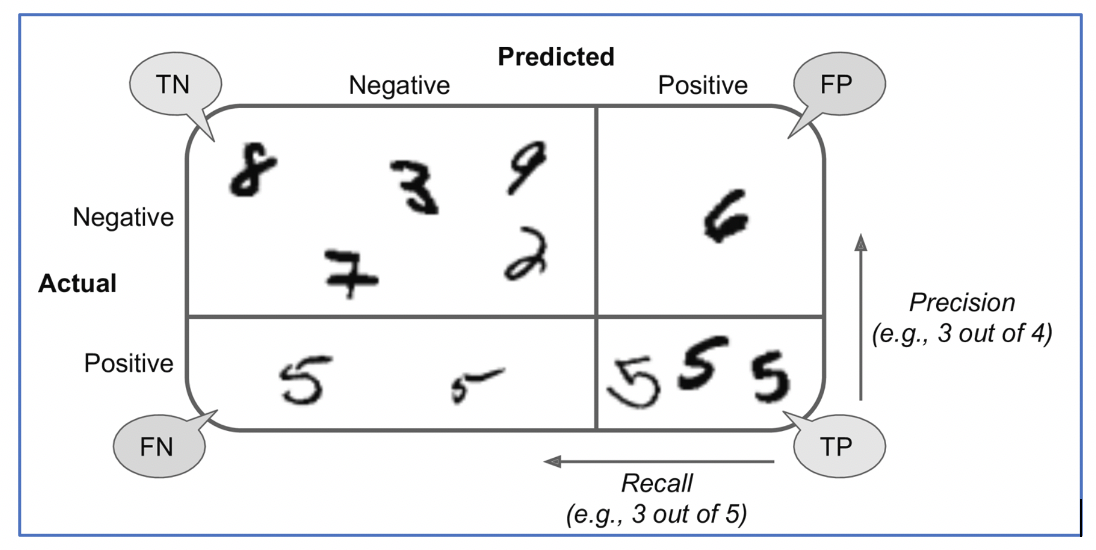
We will define that in next section. Let’s look at a diagram which shows the True Positives, False Positives, True Negatives and False Negatives.
Below is a confusion matrix for a “5” Detector
Recall
As seen in the diagram above, Recall is nothing but ratio of positives correctly identified by the classifier.
In the diagram above, we see three out of five 5’s were identified. The recall is 3/5 whereas the Precision is ¾ (see the formula for Precision that we defined earlier)
What is the formula for Recall ?
Recall=TP/(TP+FN)
F1 Score
As mentioned before, Precision and Recall go hand-in-hand and we have a measure which uses them both. It is called F1 Score and it is a harmonic mean of Precision and Recall
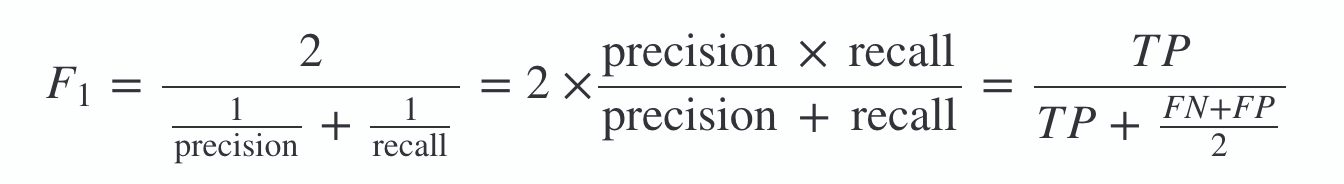
Generally, we want Precision and Recall to be similar and a high f1_score indicates that.
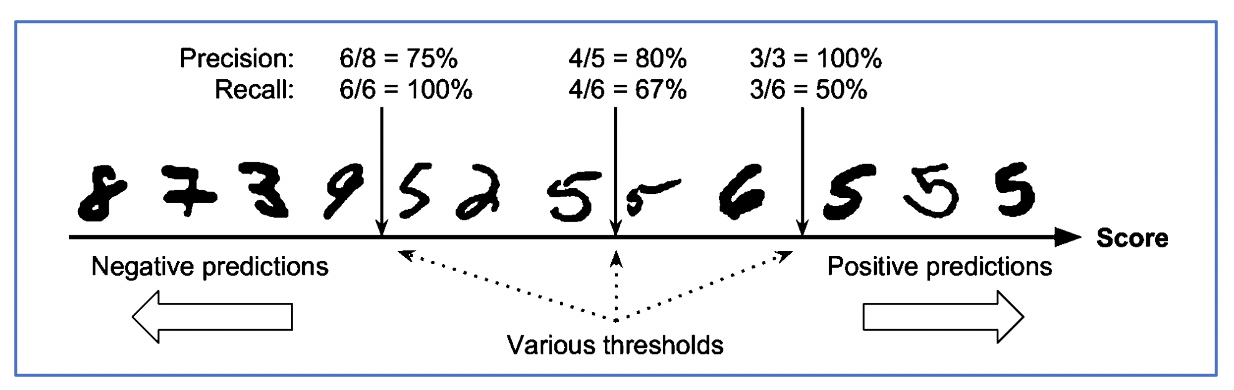
Precision Recall Tradeoff
Like mentioned earlier, we want Precision and Recall to be similar. However, in some cases we might want one of them to be higher depending on the task.
Example –
-
YouTube Kids recommendation should have high precision i.e. it should not let even few inappropriate videos even if it rejects many normal videos
-
In case of Quality Control of some object, we would want high recall because we are okay with some false positives (some good quality objects getting flagged), but do not want some low quality object to get through the detection. Human intervention can resolve the false positives.
Note - Increasing precision reduces recall and vice-versa. We cannot make both of them high.
Below diagram shows how that happens..
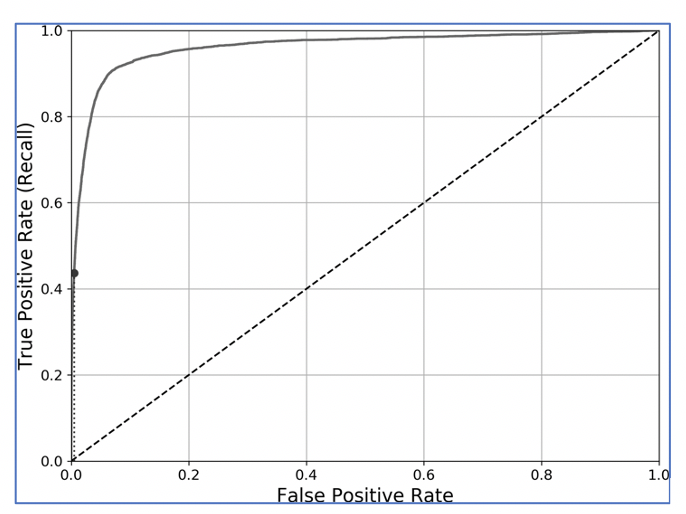
ROC – AUC
Receiving Operating Characteristic (ROC), AUC (Area under the Curve)
-
An ROC curve plots the true positive rate (nothing but recall and also called sensitivity) against the false positive rate (FPR).
- TPR (Recall) is TP/(TP+FN)
-
The FPR is the ratio of negative instances that are incorrectly classified as positive.
- FPR is FP/(TN+FP)
-
It is equal to 1 – True Negative Rate (TNR), which is the ratio of negative instances that are correctly classified as negative. The TNR is also called specificity.
- TNR is TN/(TN + FP)
-
1 – specificity.
- 1 – specificity gives 1 – TN/ (TN +FP) = FP/(TN + FP) which is FPR.
The ROC curve plots sensitivity** vs **(1 – specificity)
Area under that curve is nothing but AOC. A perfect AOC is 1.